
How to calculate customer lifetime value in ecommerce (the version your CFO will accept)

Here's how to calculate customer lifetime value in ecommerce, short enough to copy into your next deck.
Customer lifetime value in ecommerce is the contribution margin a cohort of customers produces per head over a stated window, usually 90, 180 and 365 days from their first order.
It takes three lines:
Net revenue = gross sales − discounts − refunds
Contribution = net revenue − COGS − shipping and fulfillment − return handling − payment fees
CLV = the cohort's total contribution inside the window ÷ customers in the cohort
In the worked example further down, a cohort that shows $180 per customer on the dashboard produces $61 once those costs come out. (CLV and LTV mean the same thing. This post says CLV. Your dashboard probably says LTV.)
That's the whole formula. The rest of this post covers why the version most marketing teams bring to finance gets rewritten, and how to build one that holds up.
The slide where the number dies
You're in next year's planning meeting. Your slide says LTV:CAC is 3:1, which is the number everyone's been told means healthy. The CFO looks at it for about four seconds and asks one question. Is that revenue or margin?
And you know the answer. It's revenue. Over whatever window the dashboard happened to default to, because nobody ever chose one.
The meeting ends politely. The CFO nods, writes a different number in their own notes, and from then on your CAC target gets set in a spreadsheet you'll never see. You keep presenting 3:1. Finance keeps planning around something closer to 1:1. Nobody says it out loud, and whatever number wins planning season sets CAC for the next twelve months.
At plenty of brands it goes the other way. Nobody in finance checks either, the 3:1 slide sets the budget unopposed, and the gap turns up a year later as a cash problem nobody can trace. That version costs more.
I've written before about how LTV drift lets a stable aggregate hide weak recent cohorts. This is the other half of the same problem. Even when you pick the right cohort, the number is usually measured in the wrong currency.

Why AOV × frequency × lifespan doesn't survive finance
The textbook CLV formula multiplies average order value by purchase frequency by customer lifespan, and every part of it pushes the number up.
First, it assumes a stable customer. Frequency and lifespan are averages across your whole file, so your best cohort from two years ago and your weakest spring cohort get folded into one customer who doesn't exist. (That customer has a name on this site: the phantom segment.)
Second, lifespan is a guess. Most brands either pick three years because it sounds reasonable, or back into it from churn, which assumes churn stays flat. It doesn't. Churn is steepest in the first 90 days and flattens after the second order, so a single lifespan figure overstates the customers who leave early and understates the ones who stay.
Third, and this is the one finance cares about, it's revenue. It ignores COGS, shipping, discounts, returns and payment fees. In apparel, those five lines can eat more than half of every gross dollar before anyone's paid for acquisition.
How to calculate customer lifetime value in ecommerce: the contribution margin version
Finance-grade CLV is contribution margin per customer, by acquisition cohort, over a stated window. Some teams call it contribution margin LTV. I call it finance-grade because a CFO can check every line of it against the P&L without re-running it.
Pick one cohort: customers grouped by the month of their first order. Use a single month, because a full year blends a November discount buyer with an April full-price buyer.
Pull gross sales for every order that cohort placed inside the window, first orders and repeats.
Subtract discounts and refunds to get net revenue. Book each refund back to the cohort that placed the order. Most finance reports book it to the month it was processed, which is why marketing's numbers and finance's numbers never reconcile.
Subtract the variable costs: COGS on units the customer kept, outbound shipping and pick-pack, return shipping and processing, and payment fees. Processing fees on a refunded order usually aren't returned to you. The full cost stack on returns is laid out in Your Refund Rate Is Lying to Your P&L.
Divide by the original number of customers in the cohort, including the ones who never came back. Dividing by repeat buyers only is the fastest way to double your CLV and lose the room.
Report it at 90, 180 and 365 days. Three numbers, side by side.
Two things stay out. Fixed costs (team, software, rent) belong in OPEX, not in a per-customer number. And CAC stays out too. It goes on the other side of the ratio, where finance can see it.
What you can estimate, and what has to be exact
Most of this can be approximated without changing the decision. A blended COGS percentage by category, an average pick-pack and shipping cost per order, and your processor's standard fee rate get you close enough to set a CAC target. Finance already has all three and can hand them over in an afternoon.
Refunds are the one line that has to be exact. They have to sit with the cohort that placed the order, because that's where the damage is biggest and where marketing's and finance's numbers drift furthest apart. If you only fix one thing, fix that.
Then give the join an owner. Store data lives with ecommerce, cost data lives with finance, and cohort CLV only exists where the two meet. When nobody's named, the pull happens once for a board deck and never again, which is how brands end up quoting a CLV that's two years old. It's the same accountability gap that sits under repurchase rate, one metric further down the line.
Read young cohorts at the same age
Cohort CLV measures what one month of new customers produced, while average CLV blends everyone you've ever acquired. It's the same cohort analysis that exposes a falling repurchase rate, applied to margin. Older cohorts, acquired cheaper and buying more often, hold the average up. The customers next quarter's budget will buy look far more like your last six months of cohorts.
That's why the most useful read is comparing cohorts at the same age. A 365-day cohort is at least a year old by the time it's complete, so it describes customers acquired under last year's offer, creative and discount cadence. You don't have to wait that long. Take this spring's cohort at 90 days and put it next to how your older cohorts looked at 90 days. If the young one is tracking below where the old ones were at the same age, your 365-day number is already too optimistic, and you know it a year before the aggregate admits it.
One caveat: compare like seasons. A Black Friday cohort will look weak next to a March cohort at any age, and all that tells you is that November is November. Put this November next to last November.
What finance does with your number
CLV to CAC compares contribution per customer with what it cost to acquire them, and payback period is how many months of contribution it takes to cover that cost.
Marketing tends to lead with the ratio. Finance tends to trust the payback period. The ratio moves when you stretch the window: pick 24 months instead of 12 and a mediocre cohort suddenly looks fine. Payback is measured in months and cash, so it maps straight onto the question a CFO at a $5M to $30M brand is asking, which is how long our money is tied up before this customer pays it back.
That's also why the 3:1 rule of thumb causes so much trouble. It comes from SaaS, where gross margins run 70% or higher and revenue and margin sit close together. Carry it into apparel on a revenue basis and you're comparing numbers that were never meant to be compared.
So bring both, built on contribution. Lead with payback. Use the ratio as the supporting line.
A worked example
The numbers below are illustrative, rounded and invented to show the mechanics. They aren't from a client.
A brand acquires 1,000 customers in March at a blended CAC of $60. First-order AOV is $90. Here's that cohort per customer, over three windows:
Per customer | 90 days | 180 days | 365 days |
Gross sales | $90 | $126 | $180 |
Discounts | −$12 | −$15 | −$18 |
Refunds | −$11 | −$16 | −$22 |
Net revenue | $67 | $95 | $140 |
COGS | −$25 | −$35 | −$52 |
Shipping and fulfillment | −$8 | −$11 | −$16 |
Return handling | −$3 | −$4 | −$6 |
Payment fees | −$3 | −$4 | −$5 |
Contribution CLV | $28 | $41 | $61 |
On the revenue view, this cohort looks great. $180 against a $60 CAC is 3:1, and the first order alone ($90) already covers acquisition. That's the slide marketing presents.
On the contribution view, the same customers produce $61 in a year. That's roughly 1:1, and payback lands right around month 12.
Same customers. Same year. One version says scale spend. The other says every March customer ties up $60 of cash for a full year before it earns anything back./

This is where the argument turns into a decision. Ask finance how long a payback the business can fund. If the answer is six months, the most this cohort can support is about $41 of CAC, its 180-day contribution. At $60 you're running $19 underwater per customer at the point finance wants its money back.

Don't move the target the same week you show that. Report revenue CLV and contribution CLV side by side for one quarter first, so leadership sees the gap across several cohorts and nobody writes it off as a bad month. A CAC target is expensive to change but you can change it back. Which CLV number the business trusts is close to a one-way door, so walk through it once, with evidence.
Then pick the lever. You can bring CAC down toward $41, or raise 180-day contribution by fixing the lines above it. In this example refunds and second-order discounts are the obvious candidates, and both sit closer to lifecycle than to paid media.
I ran this on a real brand's last 12 months while writing this post. The dashboard CLV came straight out of the data. The contribution version stalled at the third line.
Discounts and refunds were there, and together they took about a sixth of gross sales before a single product cost was counted. Discounts cost roughly three times what refunds did. Then the gaps showed up. The COGS field on every line item was empty. The shipping number was what customers paid at checkout, which is lower than what the brand pays the carrier. And there was no payment fee data at all. Three of the cost lines you need to get from revenue to contribution weren't in the data the marketing team could reach.
That's the real before and after at most brands. Before: a CLV number anyone can pull. After: a list of missing cost lines that only finance can fill. So the first step is a meeting with whoever owns the cost data, and the formula comes second.
How this goes wrong quietly
Finance-grade CLV fails without warning. It usually happens one of four ways.
A missing or wrong cost line. Return handling gets dropped most, then fees on refunded orders. Shipping often comes through as the amount charged at checkout, which is lower than the carrier bill. The number still looks precise. It's just high, and precise-looking numbers get trusted.
The wrong comparison. A seasonal cohort measured against a non-seasonal one reads as a trend that isn't there, in either direction.
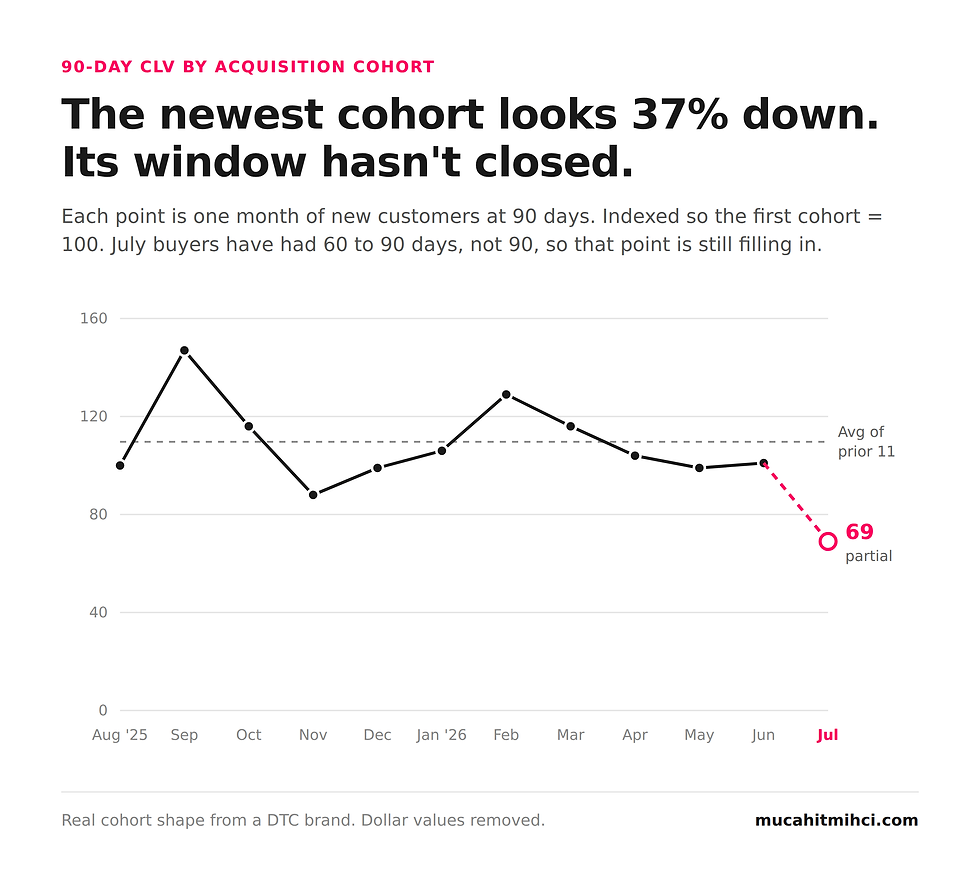
An open window. A cohort's 90-day number isn't a 90-day number until its last customer has had 90 days. Here's 90-day CLV by cohort for a real brand, pulled on the last day of September. July looks like a collapse, 37% below the average of the 11 cohorts before it. But someone who bought on July 31 has had 60 days, not 90. Some of that drop may be real. Some of it is a window still filling in, and on a dashboard the two look identical. Mark any cohort whose window hasn't closed, or leave it off the chart.
A blended CAC. If a cohort's channel mix shifted (more paid social, less search), its CAC and its CLV both moved, and one blended ratio hides which acquisition channel moved it. When mix swings by more than a few points month to month, split CAC by channel inside the cohort before you trust the ratio.
None of these throw an error. They turn up six months later as a budget set against the wrong number.
Monday morning
Pull one cohort that's at least 12 months old. Calculate its 365-day CLV twice: once the way your dashboard does it, once with every line in the table above. Put both next to the CAC you paid for that cohort.
Then ask three questions. Where are refunds booked, by cohort or by processing month? What payback period will finance fund? And who owns the join between store data and cost data? The first tells you whether your numbers can ever reconcile with theirs. The second gives you a maximum CAC you can defend. The third decides whether this gets run a second time.
You walk into the next budget meeting with their number before they have to write it down themselves.
FAQ
What is the CLV formula for ecommerce?
Net revenue is gross sales minus discounts and refunds. Contribution is net revenue minus COGS, shipping and fulfillment, return handling and payment fees. CLV is a cohort's total contribution over a fixed window, such as 90, 180 or 365 days from first order, divided by the number of customers in that cohort. The revenue-only formula (average order value × purchase frequency × customer lifespan) overstates CLV because it ignores every variable cost.
What time window should I use to calculate ecommerce CLV?
Use fixed windows measured from each customer's first order, most commonly 90, 180 and 365 days. The 90-day number is the earliest reliable read on a new cohort, the 180-day number usually maps to what finance will tolerate for payback, and the 365-day number is the one to compare year over year. Avoid "lifetime" windows with no end date, because they can't be compared across cohorts or checked against the P&L.
Should returns and refunds be subtracted from customer lifetime value?
Yes. Refunds come out of revenue, and return shipping, processing and write-offs come out as variable costs. Book each refund to the cohort that placed the original order. In categories like apparel, where return rates of 15% or more are common, leaving returns in can overstate CLV by a sixth or more before any other cost is counted.
What's the difference between predictive CLV and historical CLV?
Historical CLV is what a cohort has actually produced over a completed window. Predictive CLV is a model's estimate of what a customer or cohort will produce in the future, usually based on early purchase behavior. Predictive CLV is useful for segmentation and bidding, but finance will generally anchor budgets to historical contribution CLV because it can be reconciled to the P&L. Use predictions to act early and historical numbers to set targets.
Should ecommerce CLV use a discount rate?
For windows of 12 months or less, no. Discounting future cash matters for multi-year projections, where a dollar in year three is worth less than a dollar today. For setting next quarter's CAC target on a 90, 180 or 365-day contribution CLV, the adjustment is small enough that it adds complexity without changing the decision.


Comments